Label-free live brain imaging and targeted patching with third-harmonic generation microscopy
Stefan Wittea, b, 1, Adrian Negreana, b, c, Johannes C. Lodderb, c, Christiaan PJ de Kockb, c, Guilherme Testa Silvab, c,
Huibert D. Mansvelderb, c, 2, and Marie Louise Groota, b, 2
aBiophysics Group, Institute for Lasers, Life, and Biophotonics Amsterdam, VU University, De Boelelaan 1081, 1081 HV, Amsterdam, The Netherlands;
cIntegrative Neurophysiology, Centre for Neurogenomics and Cognitive Research, VU University, De Boelelaan 1085, 1081 HV, Amsterdam, The
Netherlands; and bNeuroscience Campus Amsterdam, De Boelelaan 1085, 1081 HV, Amsterdam, The Netherlands
Edited* by Margaret M. Murnane, University of Colorado, Boulder, CO, and approved February 18, 2011 (received for review December 15, 2010)
Abstract The ability to image neurons in living brain tissue in neuroscience and neurosurgery is a basic requirement. In particular, there is a need for the development of a non-invasive probe for brain morphology with micrometer resolution because it provides a means of non-invasive optical biopsy in clinical diagnosis. In this field, two-photon laser scanning microscopy (2PLSM) is a powerful tool and has become the standard method for high-resolution imaging of minimally invasive lesions in living biological samples. However, while (2PLSM) provides sufficient resolution based on optical methods, the need for fluorescent dyes hinders the improvement of image contrast. In this paper, we provide a high-contrast imaging method for living brain tissue with cell resolution that does not require a fluorescent probe to image using optical third harmonic generation. We use the special geometry at the cellular level and the liquid content of the brain tissue to obtain a partial match of the THG, providing an alternative to the fluorescence contrast mechanism. We found that THG brain images allow simultaneous, non-invasively labeled neurons, white matter structures, and blood vessels to be imaged simultaneously. Moreover, we used THG imaging to direct the micropipette to the designated neurons in the living tissue. This work is a major step in the imaging of unlabeled living brains and opens up the possibility of laser-guided microinjection techniques in the living brain.
Materials and Methods
THG imaging
For the THG imaging experiment, we used a commercial two-photon laser scanning microscope (TrimScope, Lavision BioTec GmbH). The light source is an optical parametric oscillator (Mira-OPO, APE) and the 810 nm pump light is from a Ti:Sa mode-locked laser (Coherent Chameleon Ultra II). Light was focused onto the sample using a 20X, 0.95 NA water immersion objective (Olympus XLUMPFL-IR). The THG experiment was described using epidetection geometry. The background scattered THG photons were separated from the incident laser beam using a beam splitter (Chroma T800lpxrxt) and filtered using a THG band bandpass filter (Chroma HQ390-70X). The detector is a GaAsP high sensitivity photomultiplier tube (Hamamatsu H7422-40) with a quantum efficiency of 25% at 400 nm. The typical acquisition time for the highest resolution imaging (1024 x 1024 pixels) is 1.6 s, and our 512 X 512 pixel imaging time for target orientation experiments is 0.6 s. A custom cast port is used for comparison with the forward port. This port uses a 1.4NA oil immersion objective, a long-wavelength splitter (UQG optics) and a 400nm coherent narrow-band filter. For the combined experiment of THG and SR-101, we used 1200nm OPO to generate two kinds of signals simultaneously. SR-101 fluorescence was separated from the THG signal using a 594 nm bandpass and a 561 nm split spectroscope. The SR-101 signal uses a PMT test (Hamamatsu H6780-20). Nile Red and THG imaging are also simultaneously excited by a 1200 nm OPO. In this case the THG signal is measured by the projection port and the Nile Red fluorescence is detected by a 593 ∕ 40 nm bandwidth filter. For THG and GFP combined imaging, the Ti:Sa laser used to pump the OPO was tuned to 970 nm and coupled into the microscope. The GFP and THG signals of the tissue block were continuously measured using the same detector. However, GFP was detected using a different (561 ∕ 40 nm) bandpass filter. Images were acquired using microscope software (Imspector Pro) and stored in a 16-bit tiff format, and image analysis was performed using Image J (MacBioPhotonics).
Main result
Fig. 1. Third harmonic microscopic imaging of the unlabeled living brain (A) Epidetection geometry of brain tissue THG imaging. Illustration: THG principle. Note that no optical excitation occurs in the matrix. (B) Focusing the laser beam at the dendrite. By setting the laser focus volume to several times the dendritic diameter, partial matching can be achieved and a significant THG signal will be generated. (C) Focusing the laser beam in the cell body. No THG signal is generated due to poor structure matching state. (D) Imaging of living neurons in mouse brain tissue. Somatic cells exist as shadows.
Fig. 2. THG imaging of living brain tissue
(A) THG images of mouse cortex (B) Two-photon fluorescence images of Nile Red staining at the same position as A (C) THG images of brain recesses in rat recesses (horizontal section) (D) THG images of mouse corpus callosum, The axon bundle is clearly distinguished. Movie S1 is a THD image (coronal) of a 3D projection (E) mouse striatum of this structure. White matter and neuronal cells are clearly visible. The bright granular structure is the axon fibers that traverse the plane of the image vertically. Movie S2 is the 3D projection of this area. (F) THG images of the upper cerebral cortex of anesthetized mice (z stack average projection density is 50um)
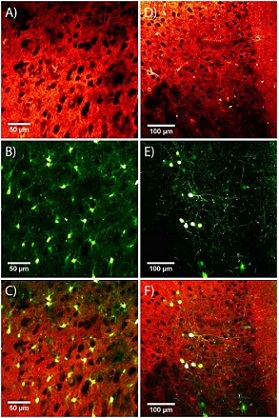
Fig. 3. Overlay of THG and two-photon imaging
(A) THG images of the anterior cerebral cortex of mice (B) SR-101 labeled star cell two-photon image (C) The superposition of A and B provides information on the distribution of star cells in the neural network (D) THG image of anterior cortex (E) Two-photon fluorescence image of GFP-labeled somatostatin neurons (F) The superposition of D and E shows the distribution of somatostatin neurons in the anterior cerebral cortex
Fig. 4. THG imaging depth and automated cell detection (A–C) THG images of the anterior lobes of the mouse, with imaging depths of 100, 200, and 300 μm, respectively. Each image is an auto-detected THG image of three neuron cells at a maximum density projection (D) of 110 μm depth with independent images at 2 micron depth intervals. The algorithm for cell detection is defined as the neuron (E) red marker shown in red: the cell visibility comparison of the image stack from the AC. Black Mark: The average detected THG density as a depth function.
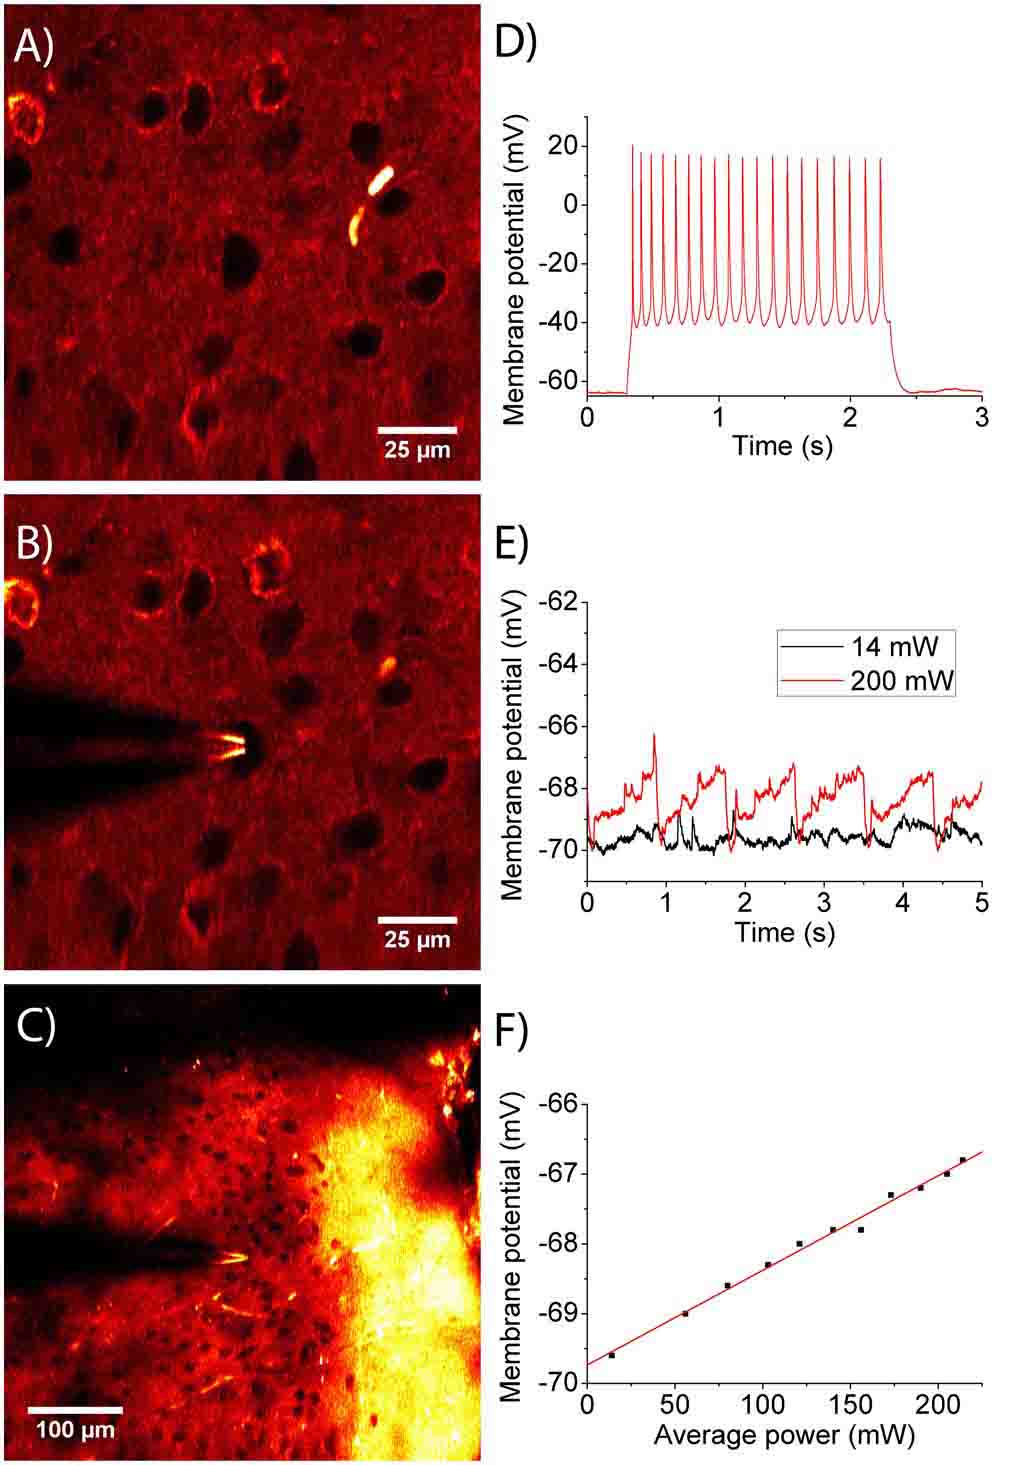
Fig. 5. Unmarked target orientation and cell viability
(A) THG images of new neocortex in mice (B) THG images at the same position after THG-guided patch clamp on one neuron (C) Large-field THG images clamped to neurons at a depth of 200 μm (5 Image averaging with a depth interval of 2 um) (D) Recording the dynamic potential training of the clamped neurons in B with a 100 pA current pulse (E) Measure the change in the resting membrane potential during the THG scan. Even with the highest energy, only 4% of the voltage change was observed, maintaining complete reversibility. The 0.8 second period corresponds to the image scan time. (F) Laser energy at the maximum observed static membrane potential Vs scan. No nonlinear effects appear.
Portable Vet Ultrasound Series
Wireless Ultrasound for animal
XProbe-C Convex, suit for big placenta of cattle and horse
XProbe-L Linear, suit for small placenta of cattle and horse
XProbe-N Suit for sheep
Feature:
· High cost-effective
·Wireless connectivity, easy to operate
·Small and light,easy to carry
Specifications:
-Scanning mode: Electronic array
-Image mode: B, B/M
-Frequency: Convex 3.5MHz/5MHz, Linear 7.5MHz/10MHz
-Scan Depth: Convex 90/130/160/200mm, Linear 20/40/60/100mm
-Probe Radius/Length: Convex R60, Linear L64
-Image Adjust: Gain, DYN, Focus, Depth, Harmonic, Denoise
-Puncture assist function: the function of in-plane puncture guide line, out-of-plane puncture guide line, automatic blood vessel measurement, and the enhancement function of needle point development.
-Cineplay: auto and manual, frames can set as 100/200/500/1000
-Measure: Length, Area, Angle, Obstetrics
-Image frame rate: 18 frames/second
-Image save format: jpg, avi and DICOM
-Battery working time: 6-8 hours
-Charge: by USB
-Length: 800mm
-Weight: 600g
-Wifi type: 802.11g/20MHz/5G/450Mbps
-Working system: Android
Portable Vet Ultrasound,Vet Untrasound Probe,Veterinary Ultrasound Machine Portable,Animal Ultrasounder Scanner
Guangzhou Sonostar Technologies Co., Limited , https://www.sonoeye.com